Many consumer and business IP networking trends are being driven by "visual networking," a combination of video sharing and viewing, social networking and advanced collaboration applications like video conferencing. As smarter and more "wearable" connective devices enter the market, forecasting and understanding these trends is critical for business, government and educational organizations to prepare for increased IP traffic demands.
Building from their Visual Networking Index (VNI) Global IP Traffic Forecast, 2013 – 2018 report, Cisco set out to visually showcase these trends in a unique way that would resonate with those seeking Cisco-specific insights and those who wanted more general information about global IP trends. With a significant amount of complex data to share, Cisco set out to meet several objectives in creating what was the final project, the Visual Networking Index (VNI) Interactive Infographic, which achieved the following:
- Generate awareness of VNI study findings with core demographic of bloggers, service providers, regulators and media members.
- Create a customizable, interactive and "shareable" asset that highlighted a multitude of trends across the globe.
- Host a 'gated' asset that would allow for lead generation
The VNI Interactive Infographic allowed users to view projections for global IP traffic through 2018 and customize their searches. More than 13 million impressions and 6,725 online conversations later, it remains an invaluable digital asset.
Cisco is challenged with telling the stories behind highly technical products, services and solutions in an easily-digestible manner that resonates with influencers, business leaders, media and consumers. With the release of its VNI Global IP Traffic Forecast, 2013 – 2018, the company once again rose to the challenge, telling the story of global technology trends that shape and influence our lives, creating the Visual Networking Index (VNI) Interactive Infographic.
The complexities of the VNI forecast –a lengthy document – was apparent to the Cisco Service Provider social media marketing team. The potential for time-strapped readers to turn away from the intensive and wordy research presented the team with the perfect opportunity to alleviate this concern, pushing them to outline several objectives when creating the infographic:
- Create a condensed, digestible and customizable asset that enabled users to view results based on regions and topics of interest.
- Ensure the final asset was readily shareable on social media channels.
- For the first time, host a "gated" asset that allowed for collection of pertinent contact information from infographic users.
- Encourage leverage of the VNI forecast as an industry standard on global traffic tracking and projections, driving further interest in the overall study.
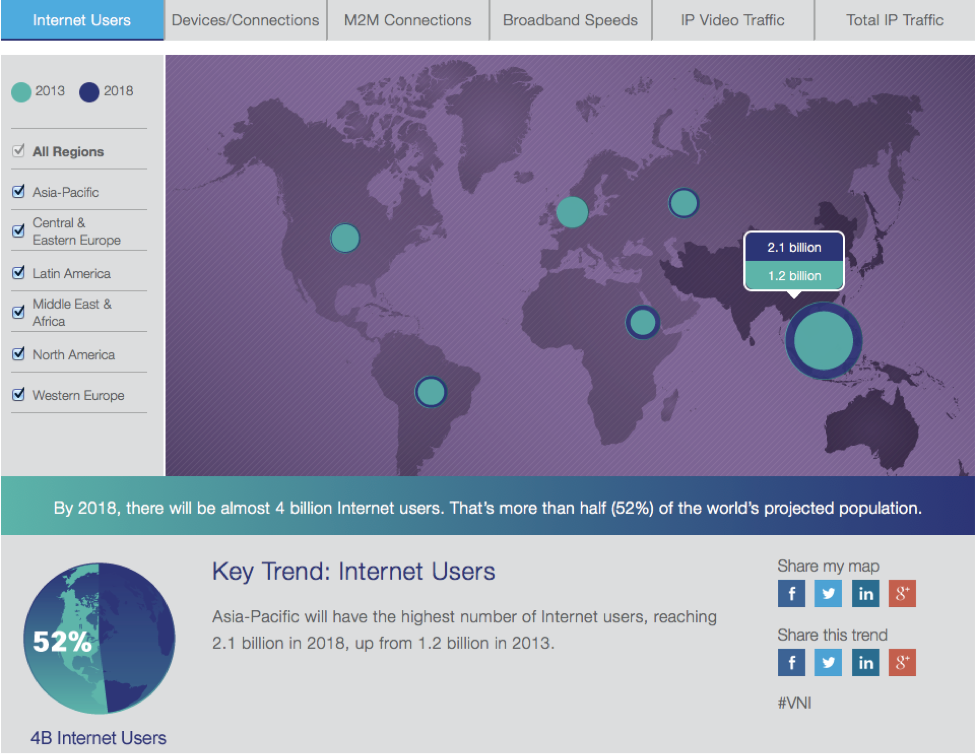
The VNI Infographic landing page features a world map with interactive "touch points" on the Asia Pacific region, Central, Western and Eastern Europe, , Latin America, the Middle East and Africa, and North America. With a simple mouse click, users can choose from six categories (Internet Users, Devices/Connections, M2M Connections, Broadband Speeds, IP Video Traffic and Total IP Traffic) highlighting the region of their choice to view correlating statistics.
Each interactive touch point is color-coded, showcasing the growth in each trend, from 2013 to 2018. For example, selecting North America, users can quickly see a color-coded juxtaposition of date-sorted data for the region; there were 287 million Internet users in 2013 and 317 million projected for 2018. The visual demonstration of this trajectory is important, serving as a digital roadmap that influences staffing, technology investments, budgets and more for the public sector, educational market, retailers and private entities. To drive lead generation in addition to awareness, the VNI Infographic was 'gated' to collect contact information of key decision-makers, with the information funnelled to Cisco's sales team for follow-up.
To generate a significant amount of online conversation, the VNI Infographic was bolstered with several interactive options for users:
- "Share My Map" – Users are easily able to share general information about the forecast relevant to them and their followers across several social media sites, including Facebook, Instagram, Google+ and LinkedIn.
- "Share This Trend" – Users are easily able to share category-specific data about the forecast relevant to them and their followers across several social media sites, including Facebook, Instagram, Google+ and LinkedIn.
The infographic also highlights a suggested hashtag, #VNI, used consistently in social posts shared from Cisco's own channels and designed to aggregate all VNI conversation. For viewers who want more information on VNI findings, the infographic includes visually-engaging hyperlinked buttons to other resources such as a whitepaper, blog post, SlideShare presentation, press release and more.
In addition to building an interactive infographic hosted on Cisco's website that encouraged sharing to social networks, the social media team developed a steady cadence of social content shared on Cisco's own social media channels to drive traffic back to the infographic, creating further social buzz and amplifying the impact of the VNI. This social content included infographic screenshots and short-form video content.
In the first week after its launch, the infographic was a key component in a social campaign that generated 3,661 conversations amounting to 13.1 million impressions. Compared to the prior year's social reach of only 2 million, this campaign reached a broad and more engaged audience – all with no media budget. Several of the industry's most respected publications and websites, including Network World, PC World, Business Insider, Gigaom and Re/Code took notice of the infographic and corresponding study findings, sharing them with readers and subscribers via their social media channels.
Strategic planning, keen social media practices and careful execution were the cornerstone of the success behind the VNI Infographic launch. Visual networking continues to grow across the globe, impacting our global economy and demanding innovation from Internet service providers. The VNI Interactive Infographic serves as a visually stimulating resource that not only brings important information to the public, but also solidify Cisco's place as the innovator to follow in the technology marketplace.