
Milliman as an actuarial consulting company deals with topics that, while complex, are of vital importance to consumers across the U.S. Our goal with this data visualization project was to make our research accessible, relatable, and compelling to a broader audience, and to do so in a way that is both visually interesting yet fits within the firm's conservative brand guidelines and rigorous research standards. Our marketing materials tend to be text-heavy, traditional, and client-centric; we wanted to break out of this mold – while remaining on-brand – and explore ways to communicate our data-driven research in ways that were visually compelling, share-able, and newsworthy to both clients and the public alike..
This campaign was all about storytelling. We wanted to take complex topics and help make them understandable to a wider audience by telling a visual story in each graphic. The headline for each graphic is our attention-grabber: it pulls the reader in and asks a question you want to know the answer to. The sub-head is for our consultants and clients: it lays out the nitty-gritty of the research and provides context. The iconography clarifies and adds interest: for the flood graphic the visual of the two houses explains the concept of varying risk in a way that any homeowner can understand. We feel this work is unique because it reaches across many audiences; it is both technical and accessible, modern yet traditional. We were able to accomplish a lot and make a splash with just a few graphics.
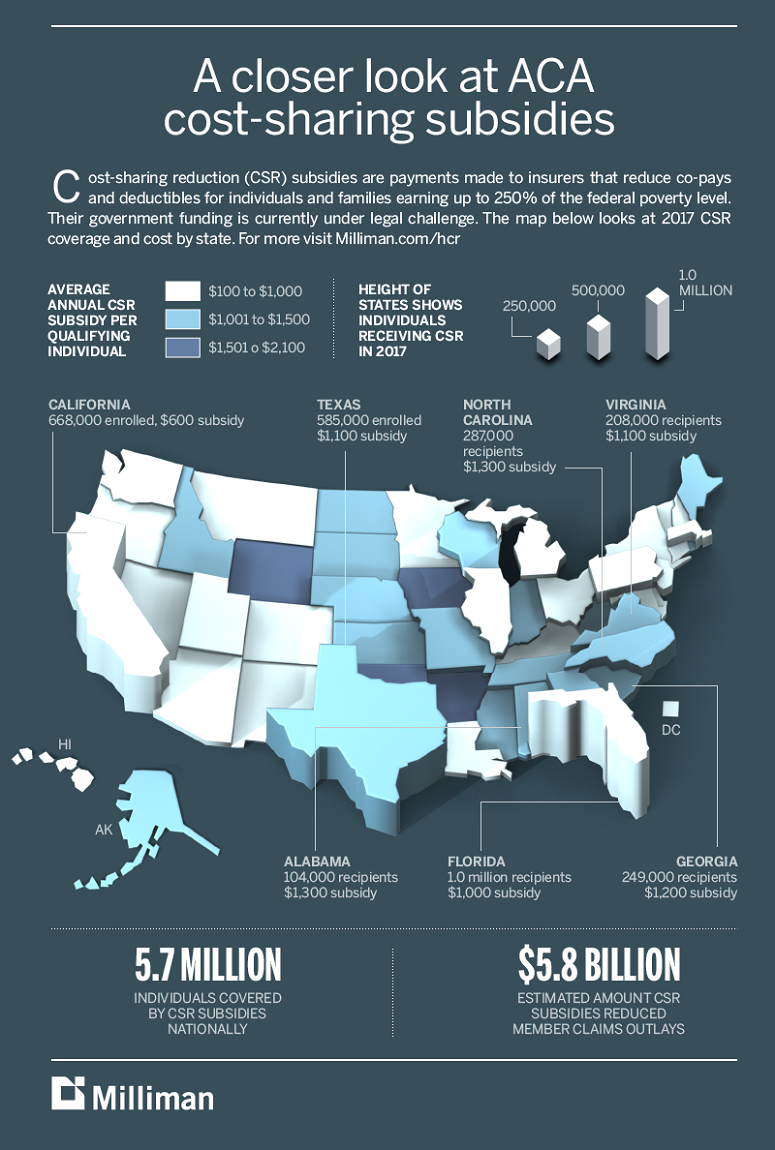
We are submitting four infographics from this campaign for consideration. Our consultants – our toughest audience – were thrilled with the way the data visualization presented their work, and felt the graphics conveyed the research in a new way and yet stayed true to the rigor of the work product. Externally the infographics were received extremely well, and met our goals of being visually compelling, share-able, and newsworthy. Our flood infographic was forwarded from clients to lobbyists to Congress where it helped generate media inquiries, influenced policy discussions, and contributed to the elevation of our lead consultant as one of the foremost flood risk experts. This consultant was recently chosen to design a new rating system for the National Flood Insurance Program. Our CSR graphic was used to pitch our health reform research to reporters, and retweeted on Twitter. Lastly our organ donation graphic was featured in Fortune magazine, and continues to help generate media inquiries around the research. Most importantly, the campaign proves to colleagues and our team that this is a worthwhile initiative that we can grow and refine in the coming year.


